What Wins on Tour – Ball Striking or Short Game?
Including the (delayed) 2020 U.S. Open, eight tournaments have now been played in the 2021 PGA TOUR season through the Bermuda Championship where Brian Gay notched his fifth career win yesterday. So far, we have used the strokes gained framework to break down the winner’s performance against the field each week, with the exception of the Bermuda Championship and the Corales Puntacana Resort & Club Championship where strokes gained data were not available.
In this post we attempt to answer the following question:
What is the relative contribution of ball striking versus the short game towards each win?
Assuming that ball striking skill is captured by performance off the tee and in the quality of approach shots to each green, we combined Strokes Gained: Off The Tee with Strokes Gained: Approach The Green to create a “Ball Striking” measure. Similarly, we created a “Short Game” measure by combining Strokes Gained: Around The Green with Strokes Gained: Putting.
If you recall from our earlier posts,
Strokes Gained: Total = SG: Off The Tee + SG: Approach The Green + SG: Around The Green + SG: Putting
Substituting our measure of ball striking and short game,
Strokes Gained: Total = SG: Ball Striking + SG: Short Game
The contribution of each component to victory can now be easily calculated as:
SG: Ball Striking / SG: Total and SG: Short Game / SG: Total
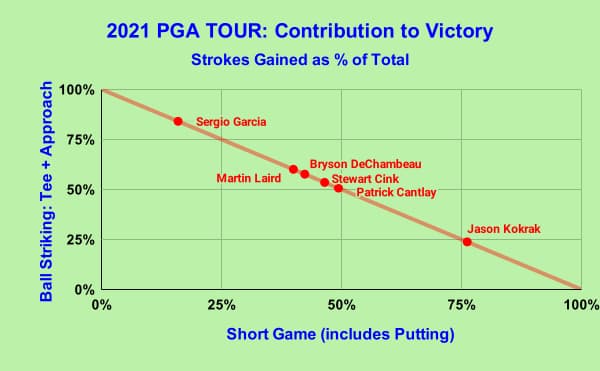
A scatter plot of ball striking vs. short game contribution to victory is quite interesting. One of the six 2021 season winners — Patrick Cantlay — relied about equally on ball striking and short game. Sergio Garcia, however, relied heavily on his ball striking to win the Sanderson Farms Championship. On the other hand, Jason Kokrak can thank his short game (which includes putting as we defined it) for his win at the CJ Cup @ Shadow Creek. The other three winners relied a bit more on ball striking relative to the short game.
It might be too early in the season to derive any conclusion with just six data points, but we can use this contextual framework to depict the drivers of victory each week and check for any pattern. We can also look at past year data — and that is something we will share in the coming weeks.
Stay tuned!